On the heels of gold breaking back above the $1,300 level, analyst David P. out of Europe sent King World News three must see charts of the silver market and warned the price of silver may hit all-time highs within the next 18 months.
Silver Set To Skyrocket To $65?
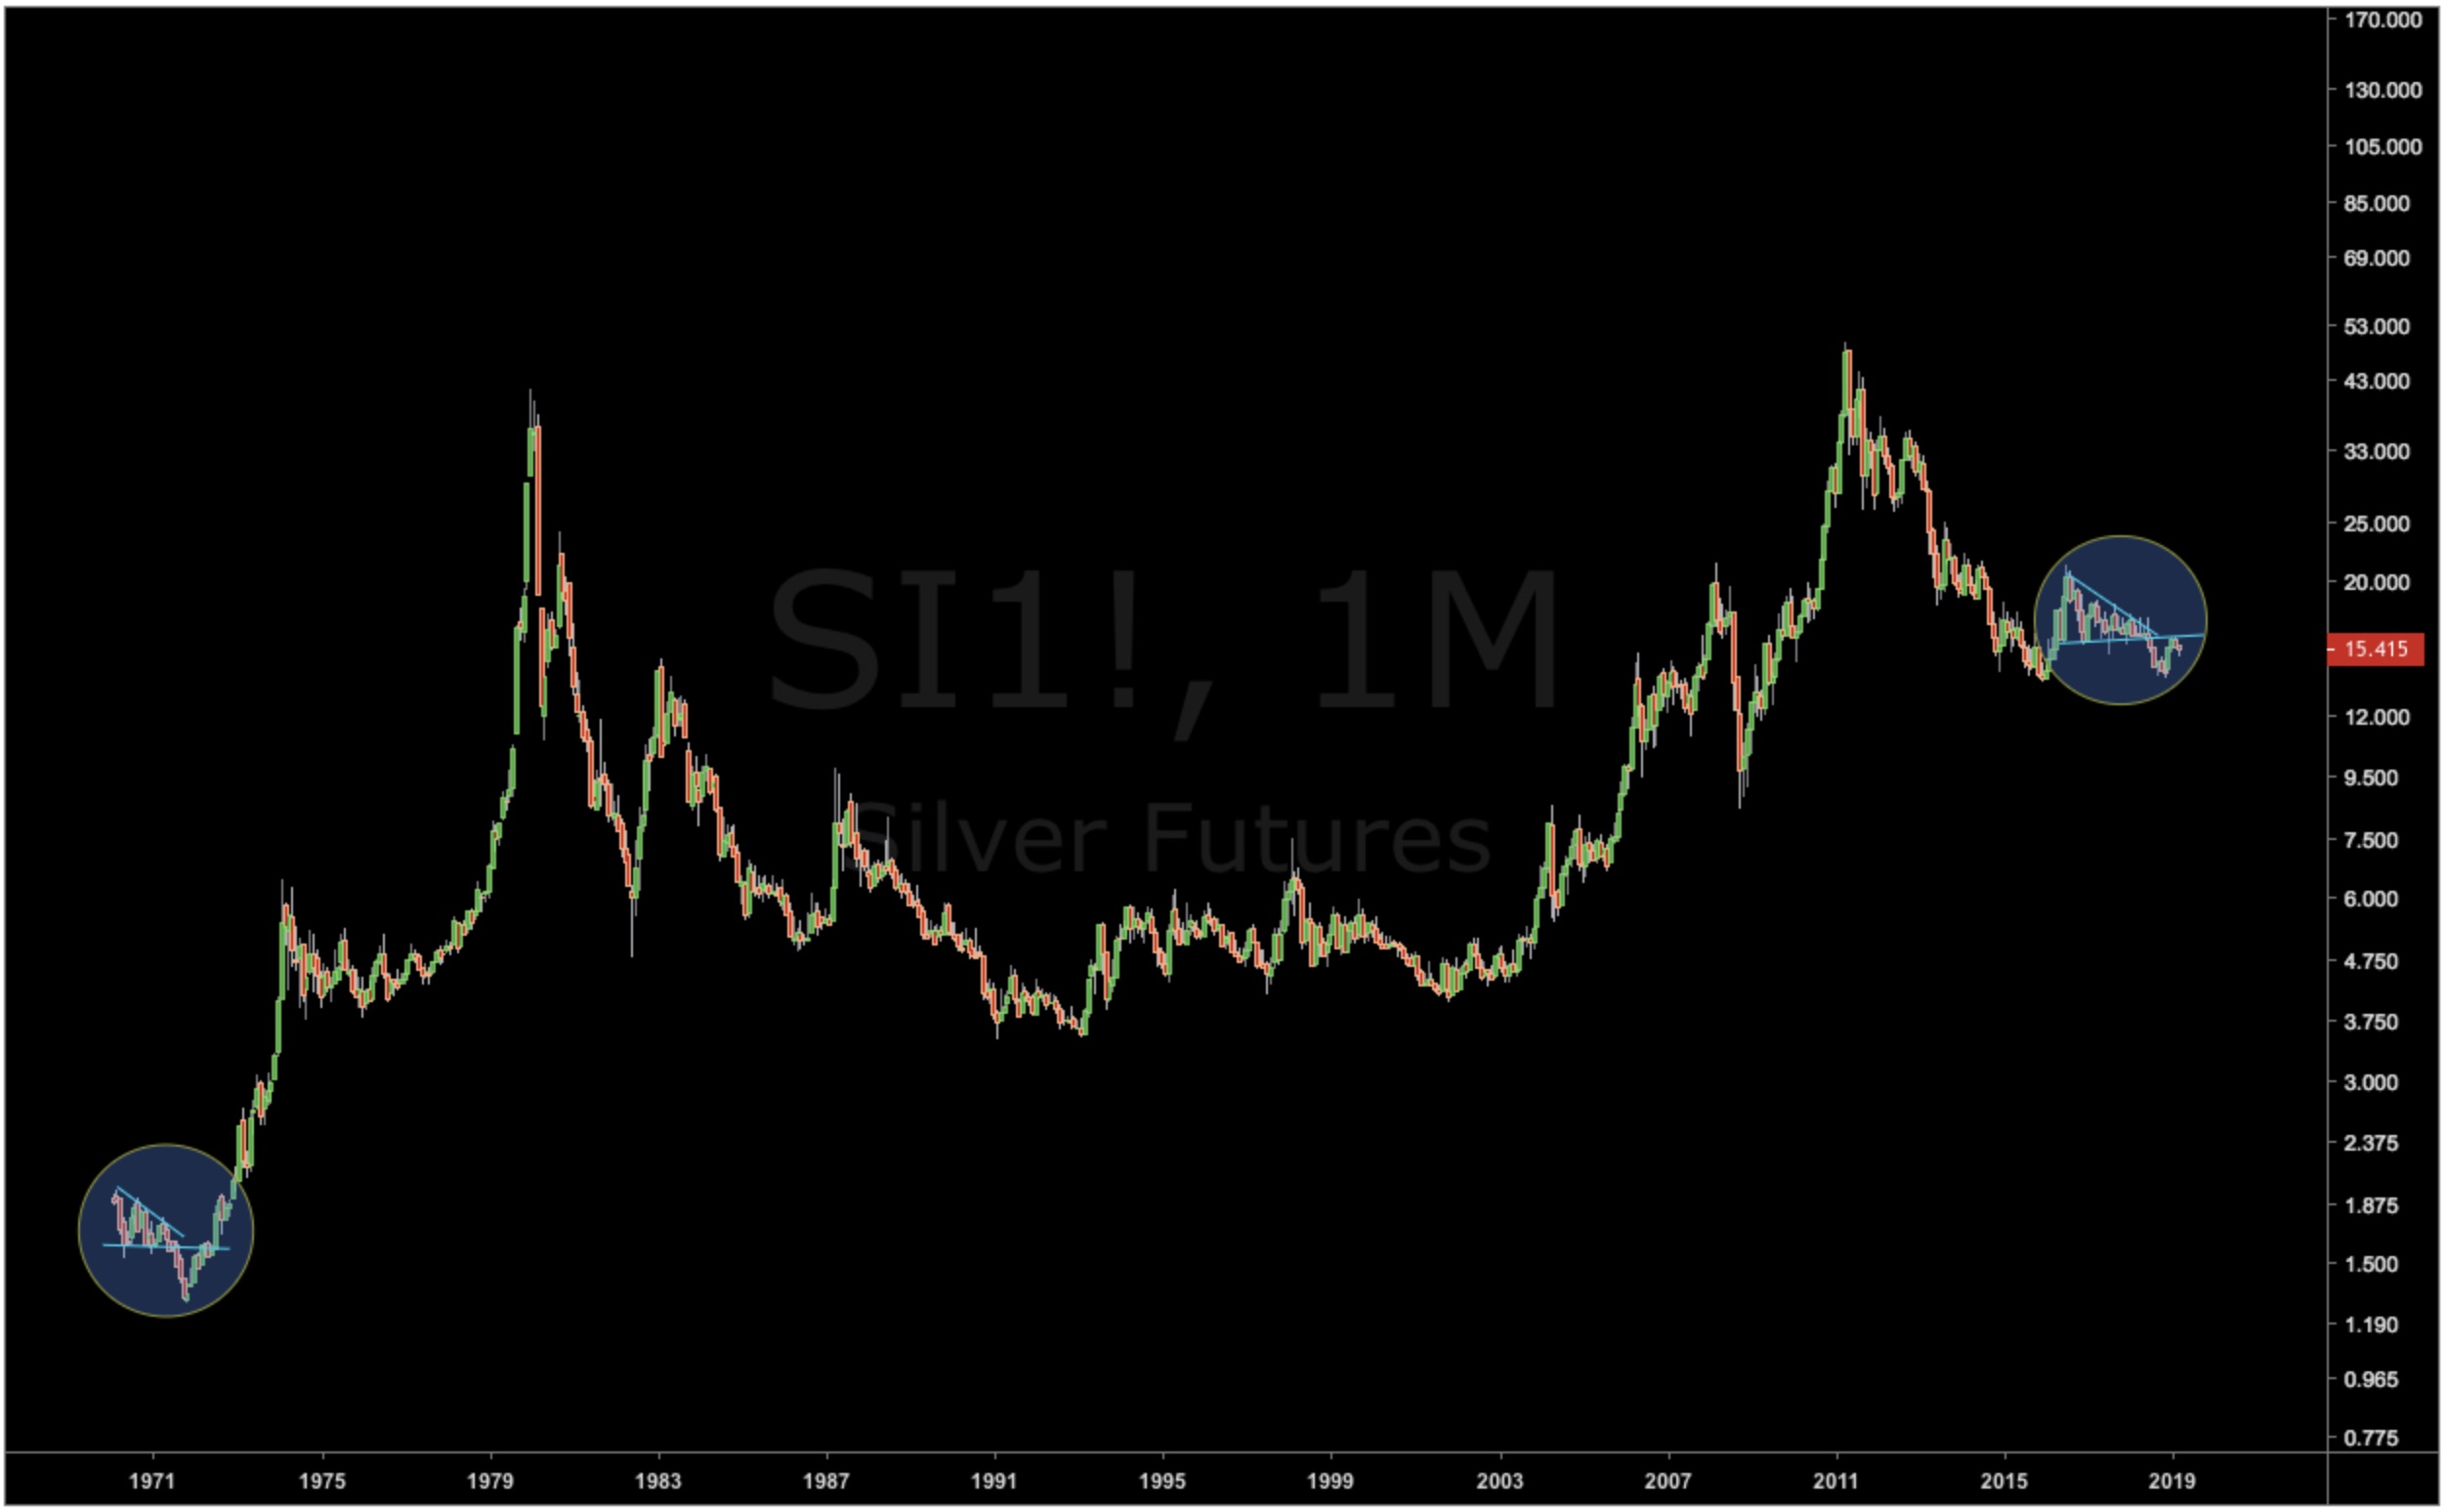
March 12 (King World News) – David P. out of Europe: “Silver continues to trade exactly like it did in the early 1970s before skyrocketing (see chart below).SILVER TRADING: Amazing Similarities To Early 1970s, Prior To Skyrocketing
I warned in June of 2018:
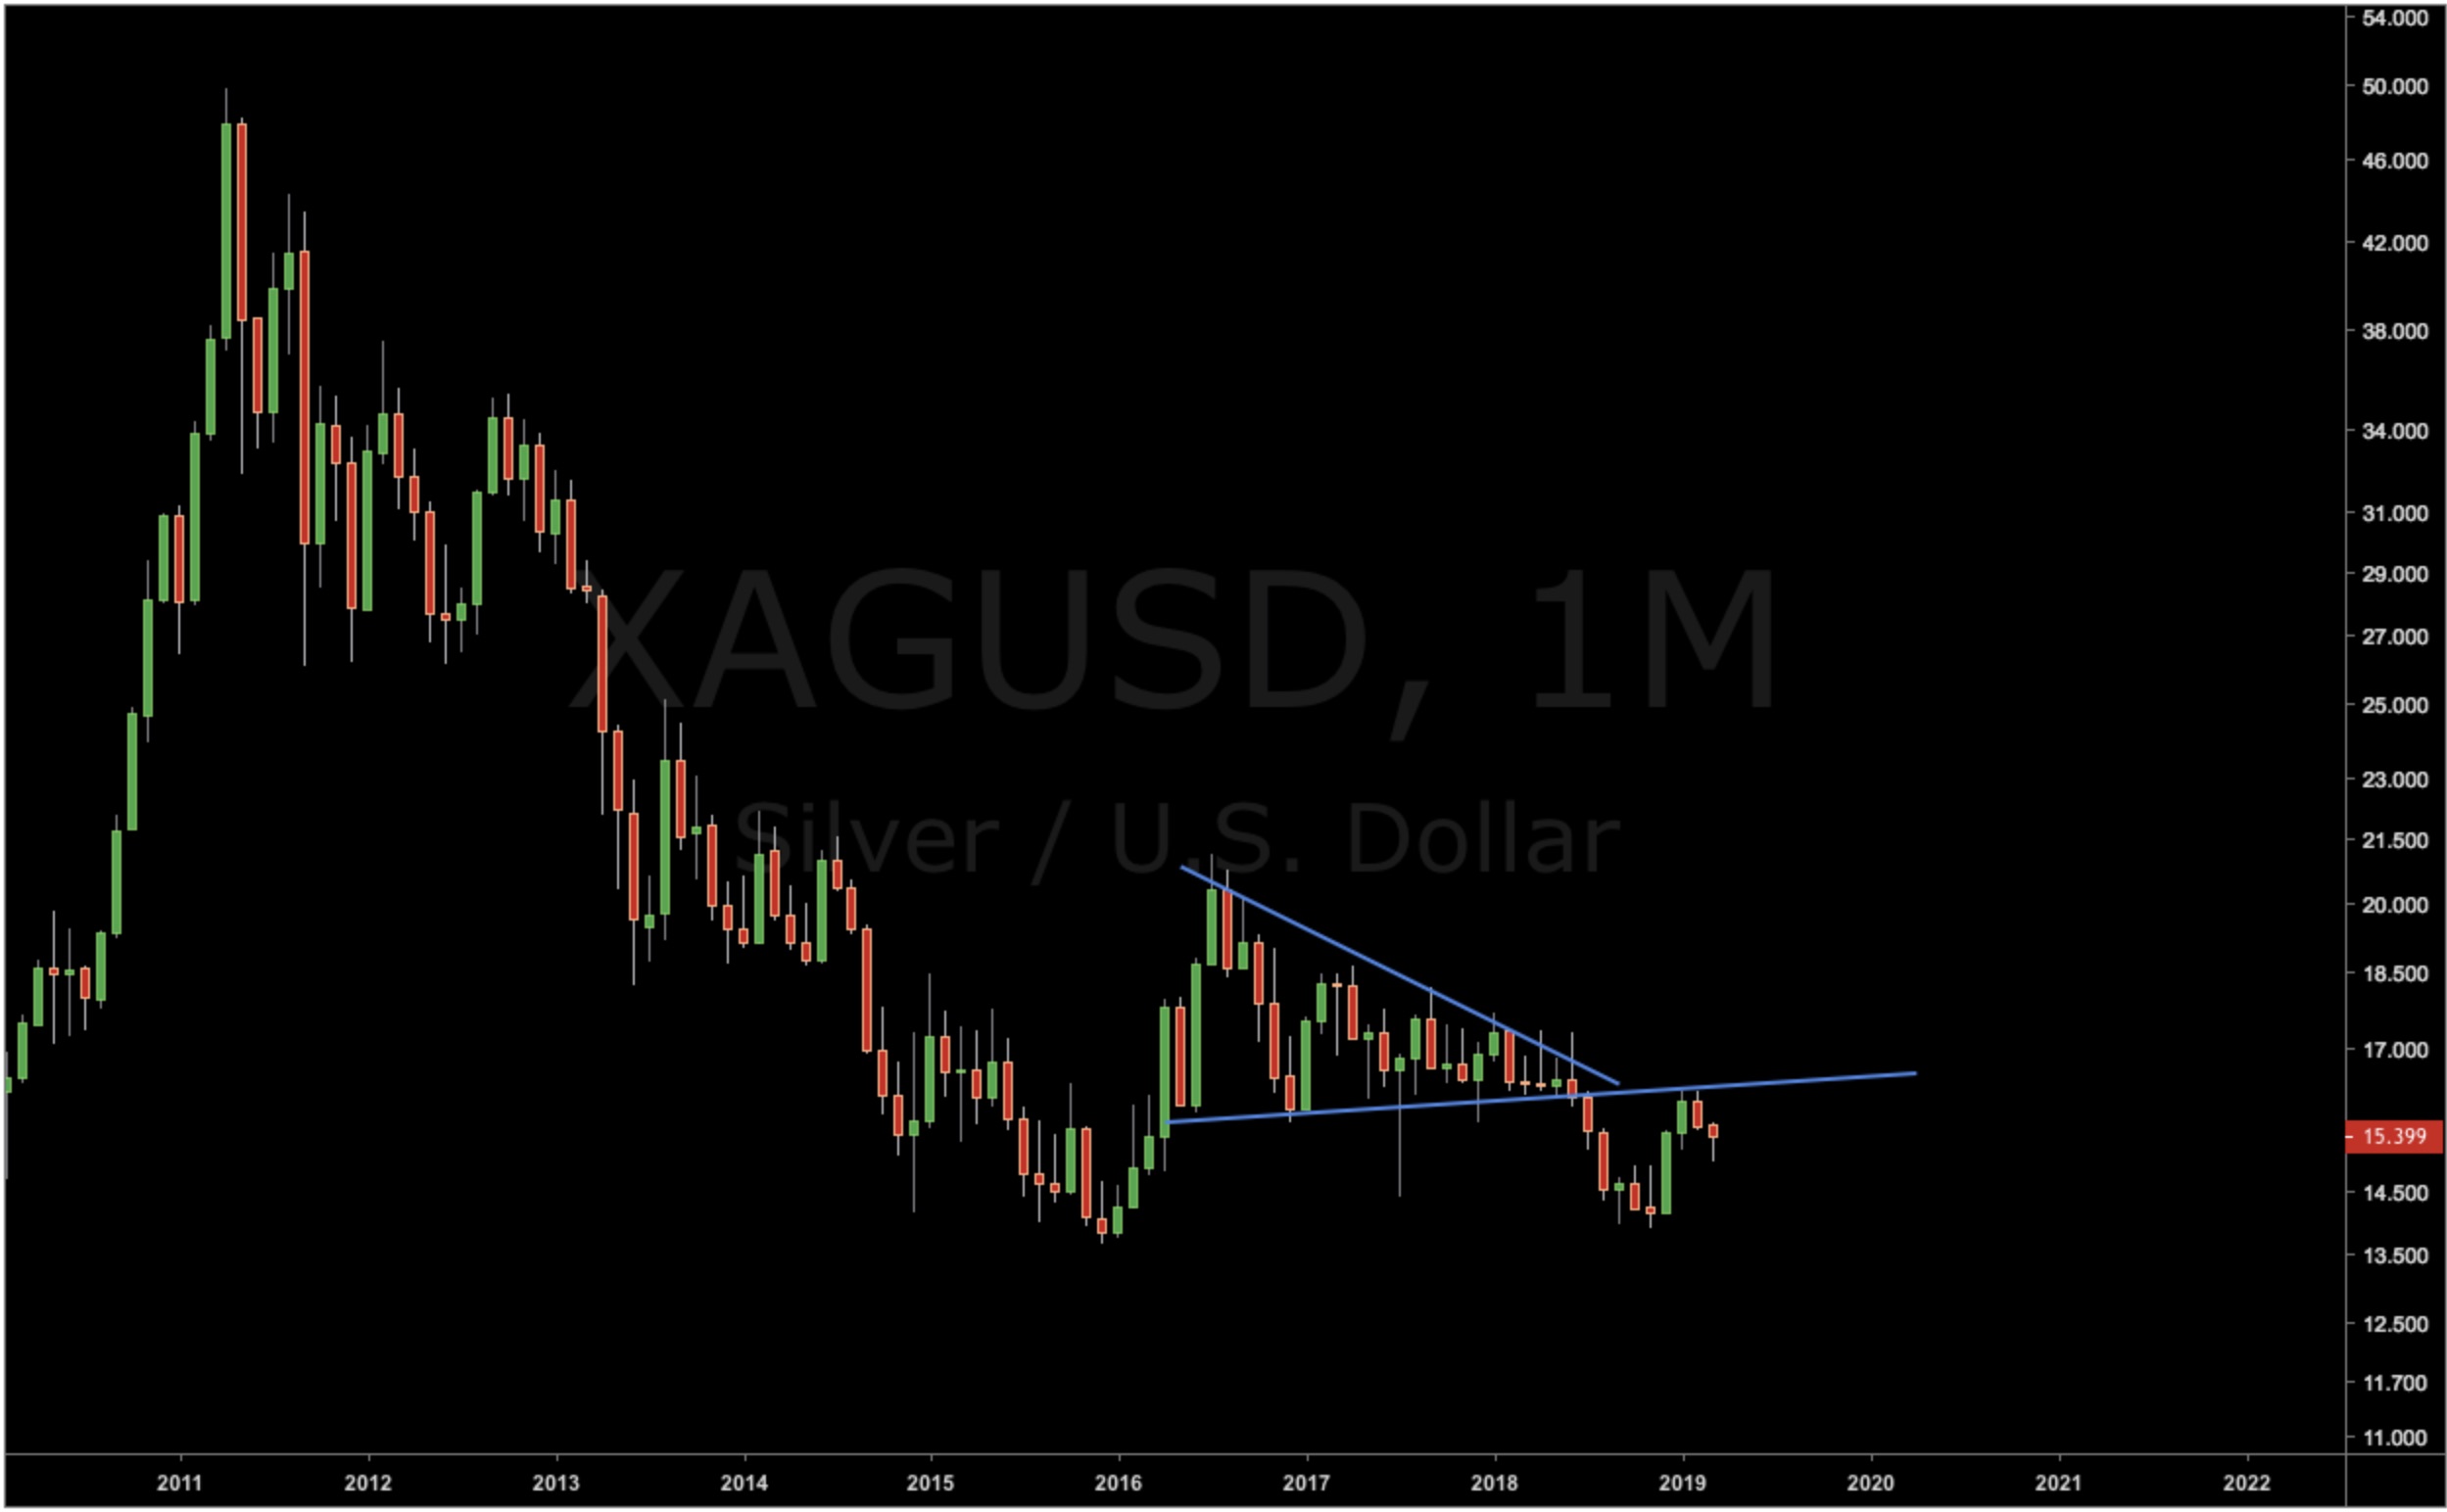
There is a possibility that silver breaks down in the next few months and with a 20% drop that takes silver sub-$14/oz before a potential bottom.
Silver did in fact break the triangle formation to the downside in 2018, as predicted last summer…
From that low, silver has bounced and is currently testing resistance (see chart below).
Silver Chart Mirroring 1970s Action Which Proceeded Violent Price Spike!
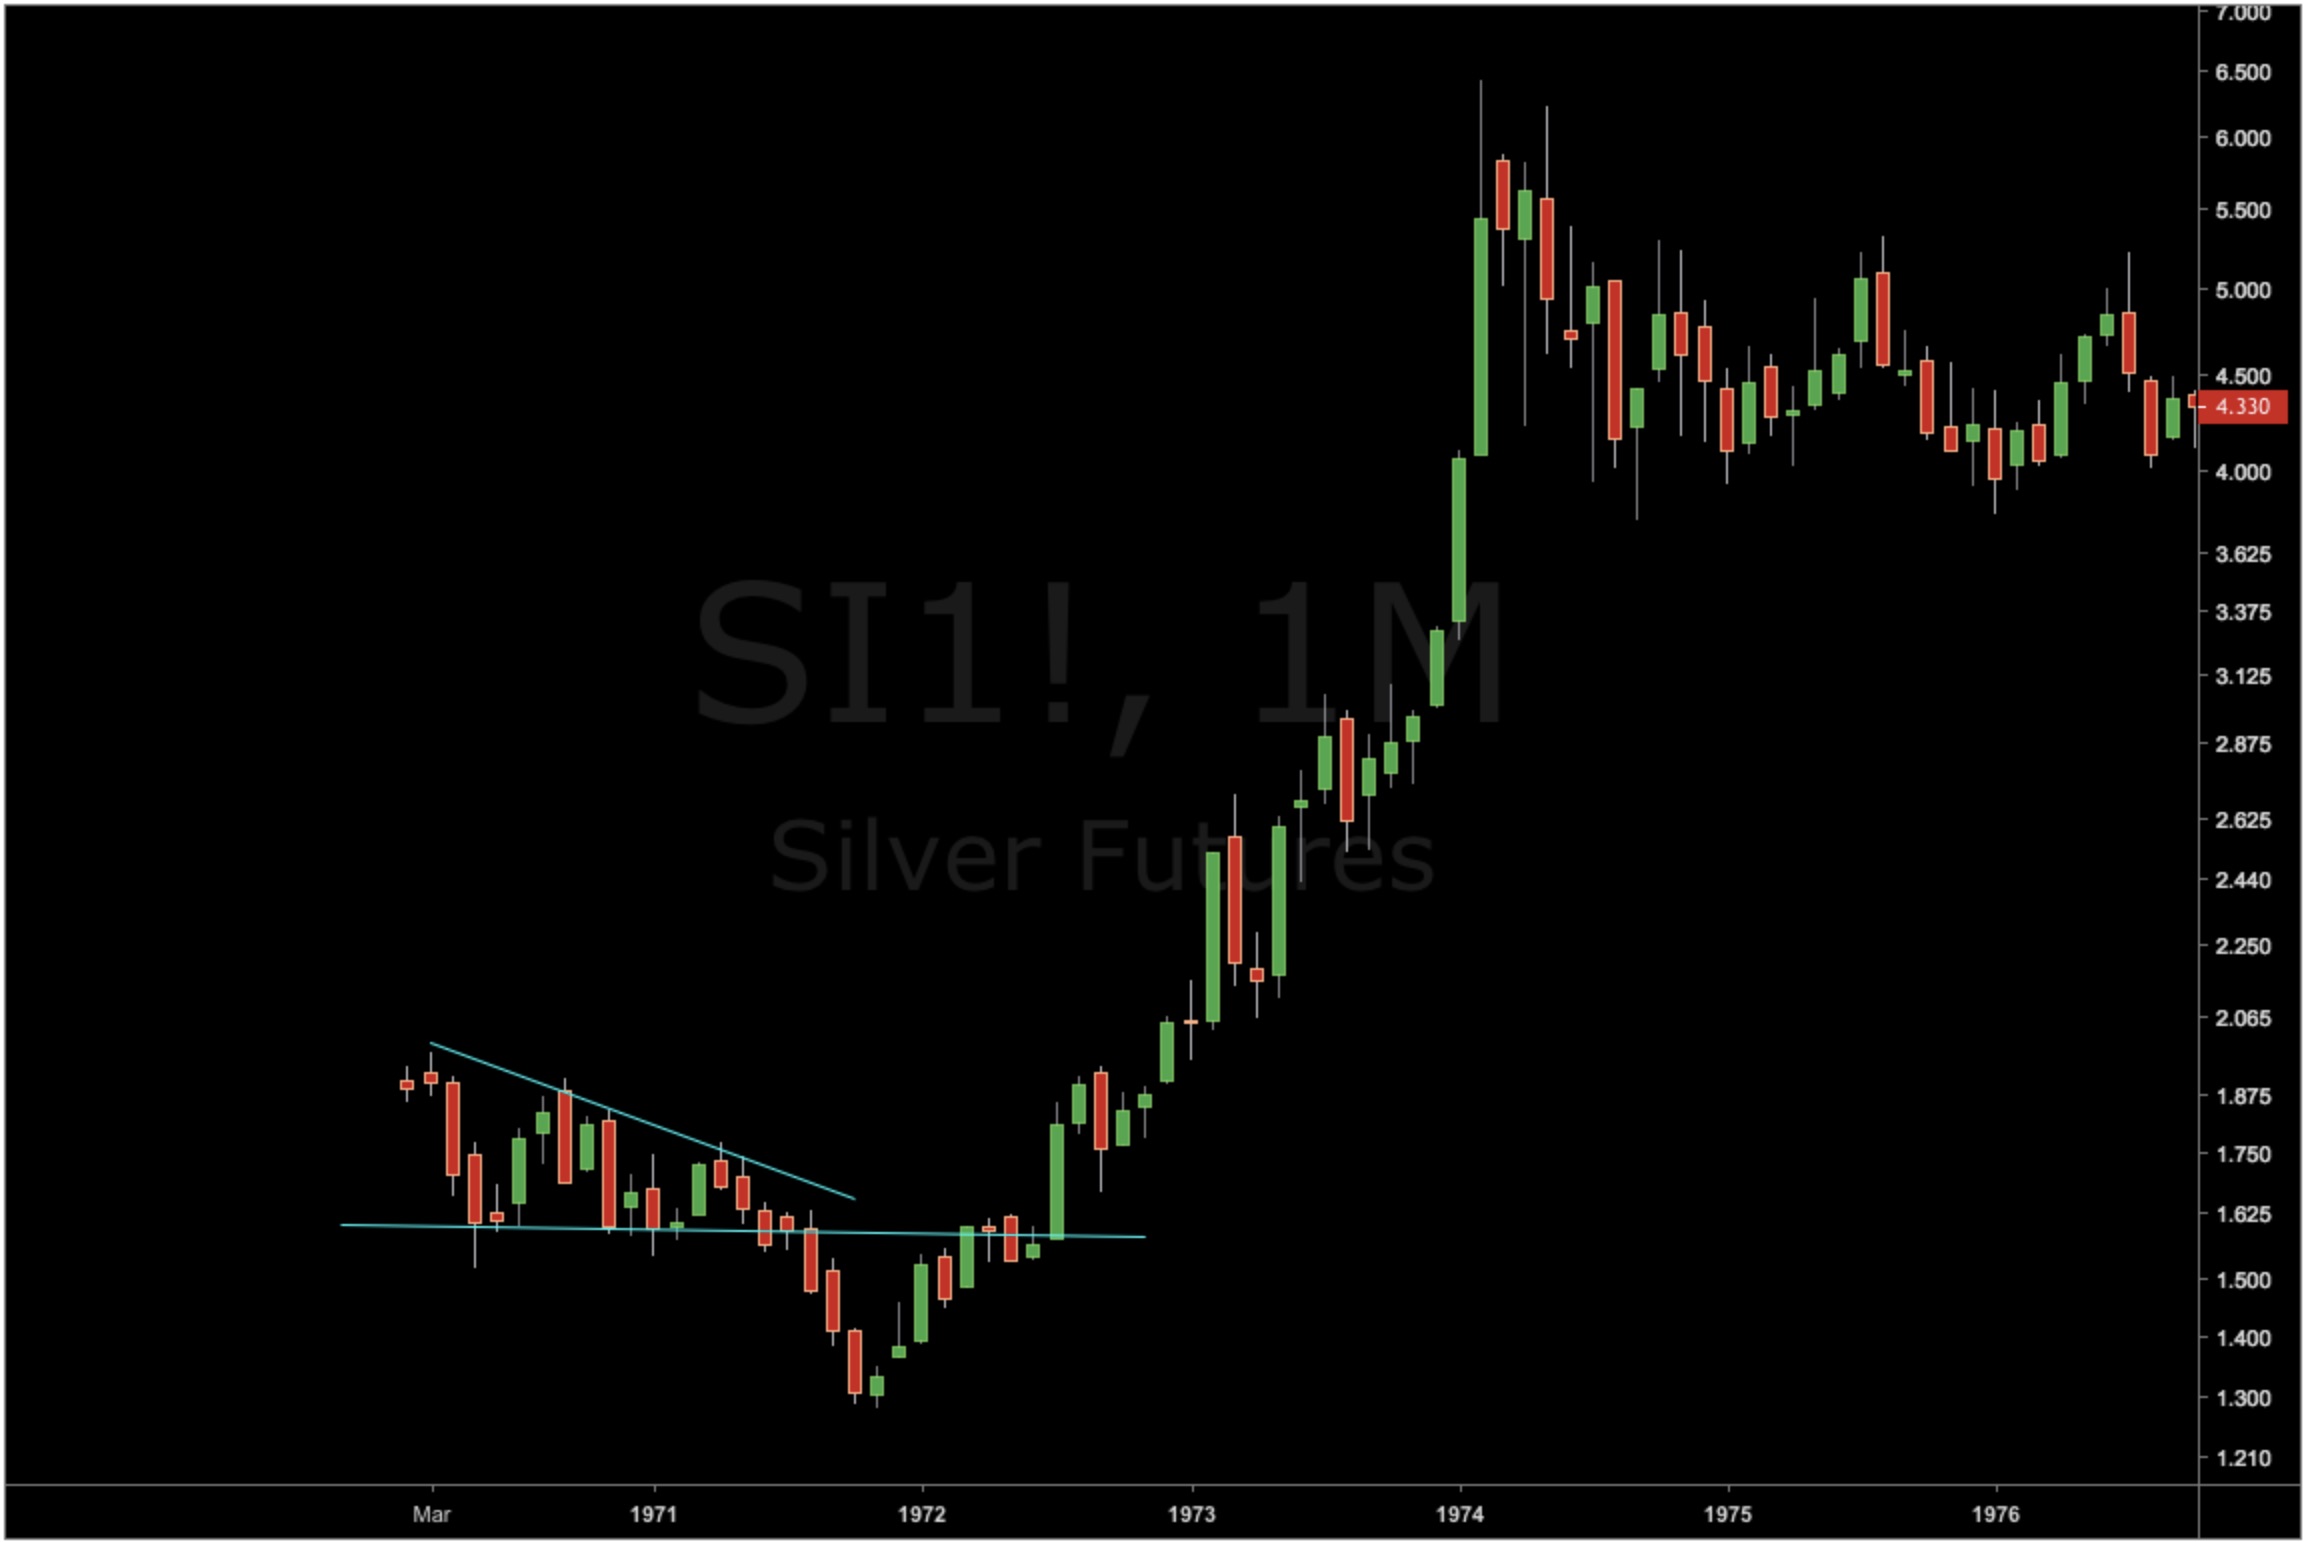
This is the exact same resistance level it tested back in 1972 before the big move (see chart below).
Look At The Amazing Similarities To 1972!
A Staggering 308% Silver Spike
As you can see in the above chart, silver rose a staggering 308% in just 18 months once silver broke out on the upside. A similar move today would take the price of silver to $65 next year.
- Forums
- ASX - By Stock
- ARD
- European Analyst Just Warned The Price Of Silver May Spike To $65 Within 18 Months
European Analyst Just Warned The Price Of Silver May Spike To $65 Within 18 Months
Add ARD (ASX) to my watchlist
 (20min delay) (20min delay)
|
|||||
|
Last
2.4¢ |
Change
0.001(4.35%) |
Mkt cap ! $25.26M | |||
| Open | High | Low | Value | Volume |
| 2.4¢ | 2.5¢ | 2.4¢ | $85.15K | 3.534M |
Buyers (Bids)
| No. | Vol. | Price($) |
|---|---|---|
| 9 | 1134503 | 2.3¢ |
Sellers (Offers)
| Price($) | Vol. | No. |
|---|---|---|
| 2.4¢ | 1318372 | 3 |
View Market Depth
| No. | Vol. | Price($) |
|---|---|---|
| 4 | 1346600 | 0.013 |
| 3 | 900254 | 0.012 |
| 5 | 5562933 | 0.011 |
| 2 | 550000 | 0.010 |
| 1 | 500000 | 0.009 |
| Price($) | Vol. | No. |
|---|---|---|
| 0.014 | 867091 | 1 |
| 0.015 | 1101911 | 3 |
| 0.016 | 200000 | 1 |
| 0.017 | 464733 | 2 |
| 0.018 | 187500 | 1 |
| Last trade - 16.10pm 15/11/2024 (20 minute delay) ? |
| ARD (ASX) Chart |


