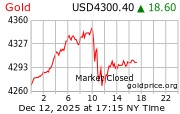
looks like your Au pennant is collapsing to downside
on verge of a breakdown.
Bullish equities & USD$ will mean Au price will drop away short term.
If you post the PRU chart you will see the same, the flagpole reversed into a bearish long red bar, the longest in 1-2 years meaning bearish sentiment ruled on friday and INSTOs cashing up profits from 31c.
45-47c seems the top range and 33-40 the low range now for traders. Thats 4 times now they would not let it pass 45-47c.
- Forums
- ASX - By Stock
- PRU
- PRU & Gold Charts
PRU & Gold Charts, page-2
Featured News
Add PRU (ASX) to my watchlist
 (20min delay) (20min delay)
|
|||||
|
Last
$2.68 |
Change
-0.010(0.37%) |
Mkt cap ! $2.265B | |||
| Open | High | Low | Value | Volume |
| $2.61 | $2.70 | $2.61 | $11.46M | 4.290M |
Buyers (Bids)
| No. | Vol. | Price($) |
|---|---|---|
| 4 | 111469 | $2.67 |
Sellers (Offers)
| Price($) | Vol. | No. |
|---|---|---|
| $2.68 | 67593 | 5 |
View Market Depth
| No. | Vol. | Price($) |
|---|---|---|
| 2 | 33681 | 0.500 |
| 3 | 87208 | 0.495 |
| 2 | 56480 | 0.490 |
| 7 | 146398 | 0.485 |
| 8 | 213601 | 0.480 |
| Price($) | Vol. | No. |
|---|---|---|
| 0.505 | 47724 | 3 |
| 0.510 | 233926 | 9 |
| 0.515 | 106362 | 5 |
| 0.520 | 145490 | 7 |
| 0.525 | 89084 | 4 |
| Last trade - 16.10pm 18/12/2024 (20 minute delay) ? |
Featured News
| PRU (ASX) Chart |
